


Although uncertainty remains around future economic growth due to ongoing trade discussions, the business aviation market is likely to be resilient in the medium term. In Q1 2025:
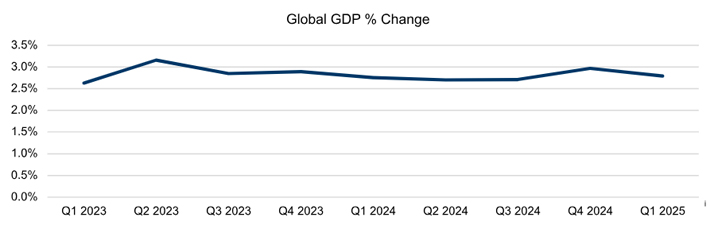
Heading into 2025, the global economy appeared to be on solid footing. Global GDP growth in 2024 held steady at around 2.8 percent, and many central banks were comfortable enough with inflation levels to begin lowering interest rates.ii
The outlook for the balance of 2025 hinges largely on the outcome of evolving U.S. tariff policies. If all announced tariffs take effect, economists project that U.S. inflation will rise and GDP growth will slow.iii Global growth would also be affected as international trade slows, particularly in export-driven economies.iv
As of the date of publication, the situation remains fluid. Some tariffs have been implemented already, while others are on hold as the U.S. seeks to negotiate agreements with its trading partners. Economists expect that overall global economic conditions in 2025 will be influenced by ongoing trade negotiations and policy decisions.v
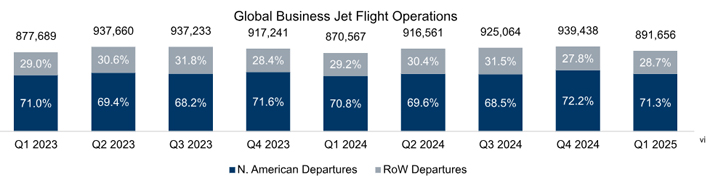
In Q1 2025, flight operations increased by 2.4 percent year-over-year, driven primarily by growth in North America. In the U.S., strong demand that began during the 2024 fall travel season and winter holidays continued into the new year. While geopolitical tensions in other regions slowed growth, flight activity outside the U.S. still demonstrated stronger performance in Q1 2025 compared to Q1 2024. Fractional operators remained the leading market segment, showcasing robust growth throughout the quarter.
Departures in Q1 2025 declined by 5.1 percent from Q4 2024, reflecting a typical seasonal pattern following the strong demand seen in Q4. This quarter-over-quarter decline mirrors the 5.1% drop observed in Q1 2024. Notably, Q1 2025 flight activity is close to the high demand levels experienced in Q1 2022, with only a slight reduction of 0.3%.
This strong Q1 performance underscores a systemic expansion of the business aviation user base over the last five years. Due to the industry’s inherent value proposition — offering personal safety, flexibility, productivity, and comfort — flight operations are expected to demonstrate resilience, despite economic uncertainty.
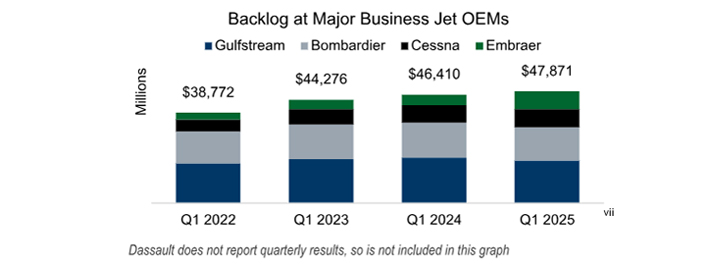
OEM backlogs rose 3.1% year-over-year in Q1 2025, reaching $47.9 billion. Growth was uneven across OEMs, however, with strong increases by some OEMs offsetting modest reductions by others. Manufacturers continued efforts to resolve supply chain and labor constraints, resulting in a year-over-year increase in deliveries. As deliveries grew and some orders were temporarily delayed by uncertainty, the industry-wide book-to-bill ratio dipped below 1-to-1 during the quarter. Despite these headwinds, OEMs remain confident in their ability to sustain higher levels of deliveries through the rest of 2025 while maintaining healthy order intake.
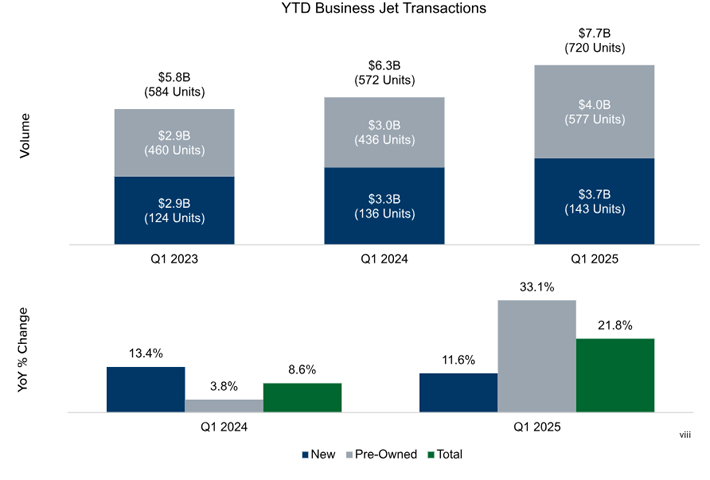
Note that Q1 2025 figures reflect preliminary data and may increase as more transactions are reported to data providers.
After stabilizing in 2024, transactions experienced an increase in Q1 2025. Year-over-year, Q1 2025 total unit volume increased 25.9 percent, while total dollar volume grew 21.8 percent. Over the past few years, new aircraft deliveries have been limited by supply chain disruptions, labor shortages, and slow aircraft certification processes. However, OEMs have worked to address these challenges, resulting in an 11.6 percent increase in new delivery dollar volume in Q1 2025. Although more work is needed, progress made so far in resolving supply chain issues is expected to help the industry navigate rising economic uncertainties throughout the remainder of 2025, with most OEMs publicly maintaining plans to increase production for the year.
Pre-owned transaction unit and dollar volumes also experienced year-over-year growth in Q1 2025. After market declines in 2023, transaction volume stabilized in 2024, with periods of strong activity occurring during the summer and at year-end. This momentum carried over into Q1 2025, driving a 33.1 percent increase in dollar volume. This growth appears to have marked the end of a period of disconnect between sellers seeking to preserve post-pandemic value gains and buyers waiting for prices to return to historical norms. The strong demand demonstrated by a healthy Q1 positions the market well, which should help the industry navigate anticipated economic uncertainty throughout the rest of 2025.
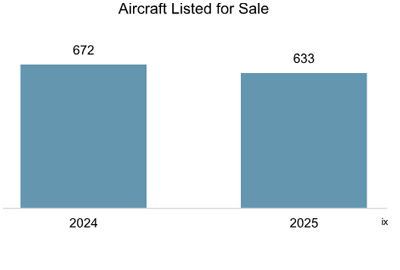
In Q1 2025, aircraft listings declined by 5.8 percent compared to Q1 2024. Following an 8.9 percent year-over-year decline in Q4 2024, this marked the second consecutive quarter of year-over-year decreases in listings. In 2021, strong demand for aircraft resulted in many transactions that involved unlisted aircraft. Additionally, public listings were 25.3 percent lower than in 2019. However, from early 2022 to mid-2024, sellers returned to publicly listing their aircraft (aligning with historical norms and driving an increase in new listings).
As the market stabilized in Q4 2024 and Q1 2025, listings declined again. While listings remained higher than pre-COVID-19 levels, much of the increase in new listings consisted of older aircraft. In Q1 2019, aircraft aged 13 years or older accounted for 60.3 percent of listings, rising to 69.2 percent in Q1 2025. Meanwhile, listings of aircraft aged 12 years or younger decreased by 28.3 percent from Q1 2019, representing 30.8 percent of total listings.
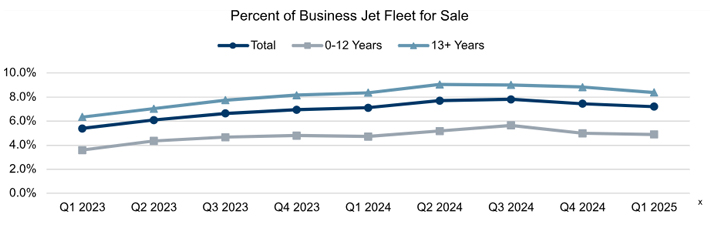
In Q1 2025, aircraft availability fell slightly from the prior quarter but rose from year-ago levels, reaching 7.2 percent of the total fleet by the end of the quarter, up from 7.1 percent a year prior. Similar to aircraft listings, this increase resulted from market normalization following the disruptions caused by the COVID-19 pandemic. As more aircraft became publicly listed, availability gradually rose from the all-time lows reached in 2022.
Despite this year-over-year rise, availability remained below the approximate 10 percent average observed over the last decade. Furthermore, strong activity in the pre-owned market during Q4 2024 and Q1 2025 contributed to sequential declines in aircraft availability. Availability fell from 7.8 percent in Q3 2024 to 7.5 percent in Q4 2024 and further declined to 7.2 percent by the end of Q1 2025.
Both younger and older aircraft demonstrated a decline in availability from H2 2024 onwards. Availability of aircraft aged 12 years and younger dropped from 5.6 percent of the fleet in Q3 2024 to 5 percent in Q4 2024, and then to 4.9 percent in Q1 2025. Similarly, availability of aircraft aged 13 years and older decreased from 9 percent in Q3 2024 to 8.8 percent in Q4 2024 and further declined to 8.4 percent in Q1 2025.
With listings in decline and availability below historical averages, the pre-owned market continues to demonstrate a healthy balance between supply and demand.
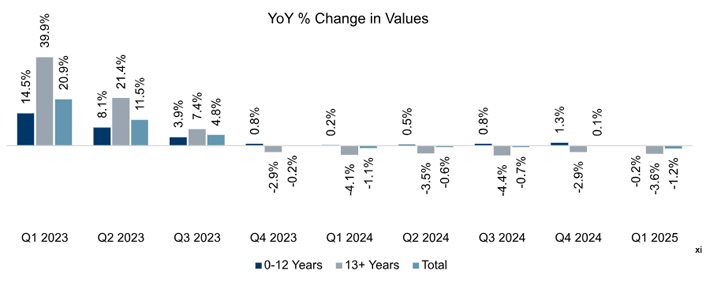
The above chart compares the year-over-year percentage change in the bluebook value of like-aged aircraft over time (e.g., the difference between the value of an eight-year-old aircraft from one year to the next). Global Jet Capital analyzes a basket of aircraft as a proxy for the overall market. Values vary on a model-by-model basis and observed increases or decreases in value are not necessarily applicable to any specific aircraft make/model. For the value of a specific aircraft, please contact a licensed aircraft appraiser.
Aircraft bluebook values were stable over the past six quarters as compared to the period between 2021 and 2023, when there were significant increases in values. High demand for business jets between 2021 and 2023 led to decreased availability and higher values. As availability increased in 2023 and 2024, the market became more balanced, resulting in stable values.
Values of like-aged aircraft in Q1 2025 declined 1.2 percent from Q1 2024, representing a resumption of historical depreciation patterns. Between Q4 2024 and Q1 2025, aircraft values declined 2.2 percent, broadly in line with historical trends.
While overall values remained largely stable, differences were observed across the installed base in Q1 2025. As noted earlier, the increase in availability was largely isolated to the older aircraft segment. Consequently, values for aircraft aged 13 years and older decreased by 3.6 percent during the quarter, whereas values for aircraft aged 12 years and younger held steady, declining by just 0.2 percent.
It is worth noting that business jets are depreciating assets and a steady decline in the price of an aircraft over its lifespan is to be expected. The current consensus among industry players is that supply and demand are well-balanced and should support stable aircraft values in the near future, despite economic uncertainty.